PV Analyzer
Analysis and Report Generation for PV Modules with PROFITEST PV
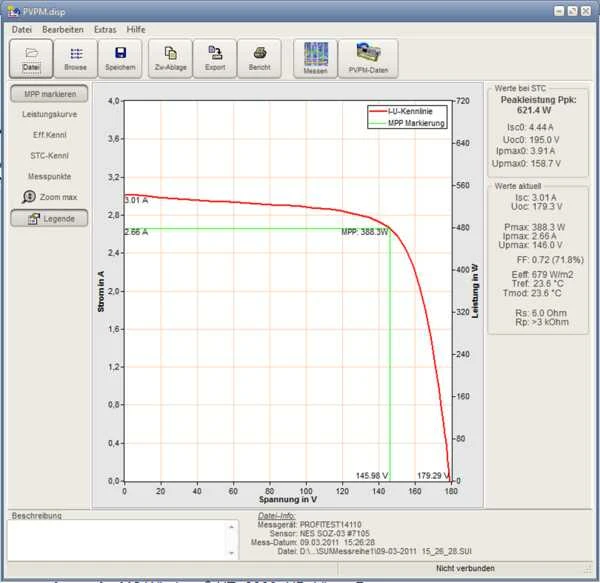
- Read in measured characteristic curve values, as well as customer and module data from the PROFITEST PV
- Graphic representation of the characteristic IU curve
– With calculated maximum power point MPP (Pmax)
– Comparison with the power curve
– Comparison with the TRMS curve
– Comparison with the STC curve
– Characteristic IU curve with display of the measuring points - Direct comparison of measured values with values obtained under STC and values for the reference module
- Overview of characteristic IU curves for a given test series in a browser window
- Export of measured values or results (e.g. XLS file)
- Generation of a test report with characteristic curve
- Generation of an analysis with error information Online measurement: graphic representation of the characteristic curve and measured values (also suitable for continuous measurement)
- Customer, module and system database
- Online access to databases / data management in the PROFITEST PV
- Runs under Windows 2000, XP, Vista, 7, 8, 8.1, 10
- The software is included with the PROFITEST PV.